
Earlier this summer, Donor Boom wrote the cover story for Marketing AdVents magazine about our proprietary forecasting revenue model. Marketing AdVents is a publication from Direct Marketing Association of Washington's (DMAW) that delivers quality content to nonprofit integrated direct response fundraisers, marketers, and engagement advocates. Forecasting is one of Donor Boom's specialties; it's an essential step in creating the best revenue growth strategies for our clients.
If you want to learn how to forecast your nonprofit's revenue, read this article. Or, Donor Boom can create a forecast for you. Check out our Fundraising Assessment service.

The Art and Science of Revenue Forecasting
Originally published as the cover story in Direct Marketing Association of Washington's (DMAW) Marketing Advents member magazine, May/June 2024. DMAW members are nonprofit integrated direct response fundraisers, marketers, and engagement advocates.

Direct mail campaigns are too expensive to execute with a hope-and pray strategy, which is why they’re data-driven. Improving your revenue forecasting skills to account for “return” and “investment” in your return-on-investment calculation will allow you to make campaign adjustments that deliver even stronger results. Here’s how you can improve your forecast for your next campaign.
Organize Your Data
First, organize your data so you can see each donor’s annual donation(s) for the past three
years. This represents their capacity and willingness to give to your nonprofit, as well as
trends in each donor’s behavior over time that a one-year look back can’t give you.
If you prefer to forecast large groups of donors rather than each individual donor, segment them using donation value ranges and then find the median average gift over the last three years.
Forecasting Formula
While forecasting is both an art and a science, I recommend starting with a simple formula:
Forecast = Projected Average Gift x Probability of Giving that amount.
Determining projected average gift is straightforward. You select the largest donation your donor has given to your nonprofit within the past three years. This donation represents their capacity and their willingness to give again because they already gave at this level. If you’re segmenting donors, use the median average donation of each group.
Next, calculate the probability of giving. This requires a deeper understanding of your donors’ relationship with your nonprofit. Nevertheless, you can call upon both quantitative and qualitative data to make an educated guess.
Leveraging Quantitative Data
So how likely is a donor to give? The quantitative data in your donor database can help answer this question. You’re likely already finding your recency, frequency and monetary value (RFM) data there. Now, look even deeper at your three-year data and ask yourself these questions:
• Did your donors give every year?
• Did donors give the same, more, less or completely inconsistently?
• Are these high-potential donors on a moves management track?
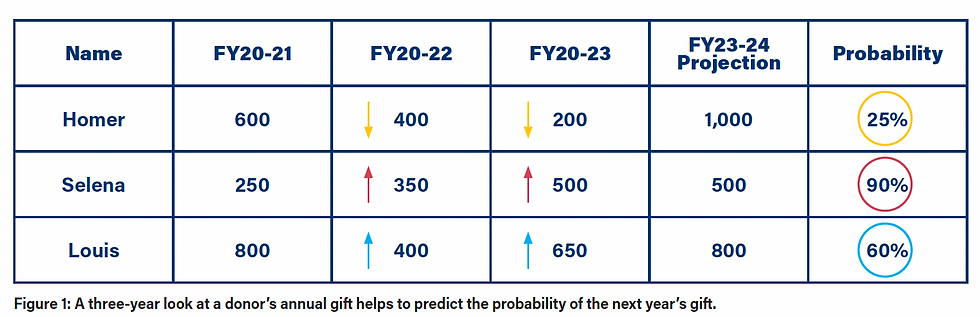
The answers will help you determine probability. (Remember, you can evaluate your
results by individual or donor segment.) If 100% probability represents a gift in hand, then a fully engaged donor whose consistent donations are trending upward every year indicates 90% probability. A donor who is giving every year but in steep decline indicates 25% probability (Figure 1).
Leveraging Qualitative Data
Quantitative data only tells part of the story. To fully assess a donor’s probability of giving,
consider the intangible aspects of their relationship to your nonprofit. Ask yourself:
• Are these donors also board members or volunteers?
• Do they have a personal stake in your mission?
• Do they attend any of your live or virtual events?
• Are they opening your enewsletter or engaging with other emails, like action alerts?
• If you use a wealth screener, how committed are they to funding your sector?
These answers are not as precise as examining your quantitative data, but you can
assign them scores on a ranked list to help you quantify them and then adjust your Probabilities to include this information too.
Next Steps
Multiply projection by probability for each donor or donor segment to see their forecasts.
Add these numbers together to get your total forecasted revenue for the year.
Your total forecast will inevitably be less than your revenue target because it relies on the status quo. Yet this is where your growth opportunity begins. If you don’t like your total forecast, this exercise gives you visibility on what and where you can improve your probabilities of giving and growing your revenue. Now, you can plan new strategies and tactics to test where they will have the most impact.
For instance, want to increase the forecast from your downward-trending donors? Add
more impact content to upcoming mailings to boost response. What about those inconsistent
donors? Test the inclusion of a three-year history of their donations in their next mailing to
increase awareness and motivation. Desperate to convert non-donors? Try sending more
frequent introductory mailings with low-cost postcards with QR codes to track scans and
responses online.
As direct mail practitioners, you know the value and the need for careful budgeting, so level-up your fundraising results with this forecast formula and be sure to apply
quantitative and qualitative information to better steer your nonprofit — and next mailing — toward sustainable revenue growth.
Comments